The most important chart of the 2012 election
The politics of the economy are heavily dependent on perception and that perception is heavily driven by the unemployment rate. (Economists roll their eyes at using such a simplistic measure to gauge the relative health of the economy but — and we can’t believe we are writing this — it is what it is.)
That’s why this chart — detailing the unemployment rate since President Obama is so incredibly important to his re-election prospects.

In the last three months, the chart has told a very different story. The downward trend in the unemployment rate has ceased and even begun to tick up slightly. (The unemployment rate in April was 8.1 percent; it was 8.2 percent in May and June.)
If the unemployment trend line stays at the status quo or rises even slightly, it’s hard to see Obama winning re-election this fall. If he does, he will be making history since it’s a virtual impossibility that the unemployment rate will dip below 7.4 percent, which is where it stood in November 1984 when Ronald Reagan won reelection. (No president since World War II has been reelected with the unemployment rate higher than 7.4 percent.)
The key to Reagan’s victory then — as it will be for Obama if he wins this fall — is that while the unemployment rate was high, it was moving in the right direction by election day.
Courtesy of the good folks at Hamilton Place Strategies, an economic-minded Republican consulting firm, here’s a comparison of the unemployment rates in the first 42 months of the Reagan and Obama presidencies.

From the 32nd month of Reagan’s presidency onward, the unemployment rate moved — basically — downward. The drop for Obama since the 32nd month of his own presidency had been moving in a similar direction — until the last three months that is.
The trend line on the unemployment rate is everything. Obama needs another downward dip — and he needs it soon.

7/6/2012 6:38 PM EDT
Here is the bottom line, what are the total new savings of consumers during the past 12 months ?
How is personal income doing ? This is the bottom line. People continue to lose homes.
We have square miles across this country of vacant and often vandalized property.
People graduating college are not earning money. The retail industry as a whole is weak. These are the realities.
We have printed trillions of dollars. We have stimulus that produced little in tangible assets such as new airport, highway, and railroad construction.
Our national debt has continued to skyrocket. We have a Congress that can't manage the appropriations process. We can't make the debt limit without the white knuckle express.
These issues are what is driving this election.See Less
7/6/2012 7:22 PM EDT
Also,
Obama has worked at poisoning the relationship between the White House
and Congress so that compromise of any kind is impossible.

7/6/2012 5:49 PM EDT
We have the first group, led by Romney, who represents the group that advocates for fighting their way forward to the main deck and the gangplank, because that — after al l— is the way they boarded and by golly that's the way they'll leave.
Then you have the second group led by Obama, who, after noticing everything that was once tied to the ground is now bolted to the ceiling, surmises that the way out of the mess is not to retrace the same steps that got you into it, and leads his followers counterintuitively to the only place remaining on the entire ship above water and they are the only ones to survive the ordeal.
For all those harkening for returning the way we came and repeating Reagan-era fiscal policies, it's time for a reality check.
1980, the year Reagan was elected, just happens to coincide with the year when the 20th century stopped its trend toward income equality and dramatically reversed course, turning into one where productivity and income growth were no longer shared by all equally, but instead only went to the extremely wealthy.
I have no doubt that you believe that this is all politics and that the numbers are being somehow skewed to promote one position over another — however, I assure you, it's not and they are not.
Here are more than a handful of charts showing how dramatically things have changed since Reagan-era policies took effect.
They come from vastly different sources, but all are verifiable and verified.
However, if you've got a chart of your own, any chart, that shows otherwise — now's the time to show them.
Now more than ever, it's time to put up or shut up:


Wednesday, September 15, 2010
A really interesting article from the New York Times which looks at the recent work of Professor David Moss, an economic policy historian at the Harvard Business School. He indicates that income disparities between rich and poor widened as government regulations eased and bank failures rose. He produces a great graphic on the subject
Income disparities before that crisis and before the recent one were the greatest in approximately the last 100 years.
- - 1928, the top 10% of earners received 49.29% of total income.
- - 1928, the top 1% of earners received 23.94% of total income.
- - 2007, the top 10% of earners received 49.74% of total income.
- - 2007, the top 1% of earners received 23.5% of total income.
Income inequality
It wasn’t always this way
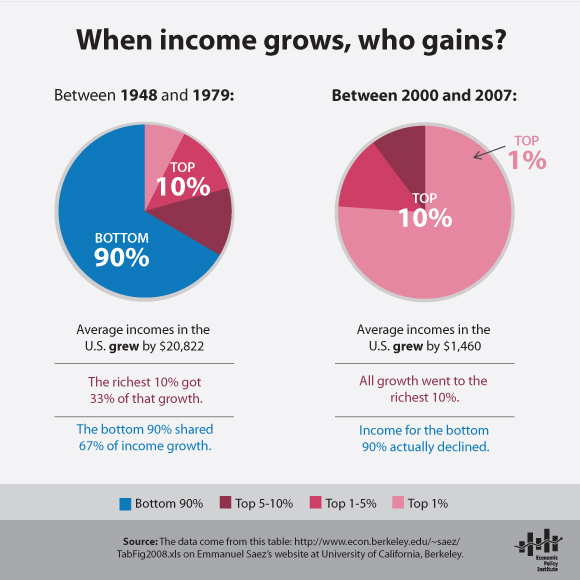
In other words, while average annual incomes over the seven-year period between 2000 and 2007 grew by $1,460, that growth was extremely lopsided. Average incomes for the bottom 90% of households actually declined. The interactive feature When income grows, who gains?, on the new State of Working America Web site, lets users look at income growth and distribution patterns for any time frame between 1917 and 2008.
This new feature lets users choose any two years between 1917 and 2008 to see how much the top 10%, versus the bottom 90%, contributed to growth in average incomes. Because income growth can change a lot during periods of recession, researchers tracking trends in inequality often chart movements between the peaks of different business cycles in order to avoid comparing a high point in one business cycle to a low point in another. The interactive feature on income distribution also shows how an increasing amount of income growth has been flowing not just to the top 10%, but to the richest 1%


7/6/2012 6:09 PM EDT
As
I recall the original Poseidon Adventure was a box office success, the
remake, like everything else in the psuedo presidency of Obama ,
flopped.
7/6/2012 6:18 PM EDT
Let me guess, the House refused to offer tickets and blocked the approaches to the movie theater.
7/6/2012 6:45 PM EDT
This
is not 1980. Romney does not have a clear plan for recovery as Reagan
did. Government spending only increased 1% to the end of his term. So,
Reagan did cut at least the growth of spending. Clinton did balance
the budget. Bush blew up the budget reacting to 911
Obama used an illegitimate form of Keynesianism and Friedmansism to blow up the national debt the further. Obama decided to be a puppet of Clinton and Bush.
So, this is worse. because there is no prospective leadership.
Obama used an illegitimate form of Keynesianism and Friedmansism to blow up the national debt the further. Obama decided to be a puppet of Clinton and Bush.
So, this is worse. because there is no prospective leadership.
7/6/2012 7:23 PM EDT
ThinkThink2,
Obama's approach is to blindly follow what FDR espoused, and FDR is
credited with prolonging the Great Depression by ten years.
7/6/2012 9:17 PM EDT
Reagan
increased taxes and increased the debt ceiling, two things the
republican congress refuses to do. the republicans are not concerned
about the welfare of the country only the benefits of their party and
the welfare of the upper 10%.
7/7/2012 6:16 AM EDT
Well
Obama killed bin Laden and got rid of Gadaffi, pulled of the most
brilliant Sepreme Court victory in history, kept student loan interest
low, beat John McCain, made a fool out of Donald Trump, kept America
secure from terrorism, is building a high speed train in California,
overhauled the food safety system, Advanced women's rights in the work
place, Ended Don't AsPassed the Hate Crimes bill.k, Don't Tell,
Appointed two pro-choice women to the Supreme Court, Expanded the
Children's Health Insurance Program, Fixed the preexisting conditions
travesty, Invested in clean energy, Overhauled the credit card industry,
making it much more consumer-friendly, He's done a lot for veterans, He
got help for people whose health was injured during the clean-up after
the 9/11 attacks and the list keeps going and going... Obama is a Winner
and he keeps winning... Oh yea, I forgot Ended the War in Iraq, Begun
the drawdown of forces from Afghanistan, Eliminated several other
Al-Qaeda leaders, Established an Energy Partnership for the Americas,
treamlined and modernized government to save taxpayer dollars, Made $20
Billion in budget cuts, Increased federal employment of individuals with
disabilities, Established White House Council on Women and Girls,
Appointment of first Latina to the Supreme Court, U.S. jail population
declined for first time in decades, Began restructuring the military to
reflect present day threats and technology, added $1.1 Billion for
improving airport security, passed the Military Spouses Residency Relief
Act, Provided $210 Million for building and upgrading fire stations,
Created a Social Investment Fund Network, Provided new federal funding
for science and research labs, Used the private sector to improve
spaceflight, Cracked down on tax cheats, Established consumer tax credit
for plug-in hybrid cars, Banned lobbyist gifts to executive employees,
New-home sales saw biggest jump in 47 years, Wind power growth up 39%
due to government stimulus, Appointed at least one Republican to the
cabinet, Provided funding for high-speed, broadband Internet access to
K-12 schools, Funded a major expansion of AmeriCorps. Deployed more
drones on Mexico border, Established Early Retiree Reinsurance Program,
Extended COBRA, Re-established the United States standing in the world,
Bolstered the military’s ability to speak different languages, Created
offshore drilling safety review board, Mandated new safety rules for
offshore drilling, Raised fuel economy standards, Tax breaks to promote
public transit, Eliminated abstinence-only funding in budget, Expanded
Pell grants for low-income students, Created task force to fight
deficit, Raised the small business investment limit to $250,000. Orders
for most durable goods rose, Increased funding for the Land and Water
Conservation Fund, Pursued a wildfire management plan, Ordered removal
of more brush, small trees and vegetation that fuel wildfires, I'M
RUNNING OUT OF ROOM HERE BUT THERE IS A LOT MORE ACCOMPLISHM
7/7/2012 9:05 PM EDT
Clever
but all wrong. Uncle Ronnie saved us from Carter's incompetence. I hope
Romney is up to the same task with the second d-cat dunce aka Obama.
No comments:
Post a Comment